Online Particle Size Analysis
Automated and digital particle size and shape analysis increases sampling accuracy and consistency compared to particle size analysis done by sieving.
The benefits of employing automatic sample analysis are numerous – as are the number of industries where it is applicable. From measuring the size of the crushed iron ore particles to the shape granulate in ESP.
Benefits with digital particle analysis compared to sieving
- Real-time particle size detection
- Real time 3D shape detection
- Continuous monitoring of the process
- Dynamic process optimization
- Accuracy, precision and repeatability
- Number based analysis
- Comprehensive morphology assessment
- Elimination of manual work
- Enhanced safety measures
- Low maintenance requirements
What is particle size analysis?
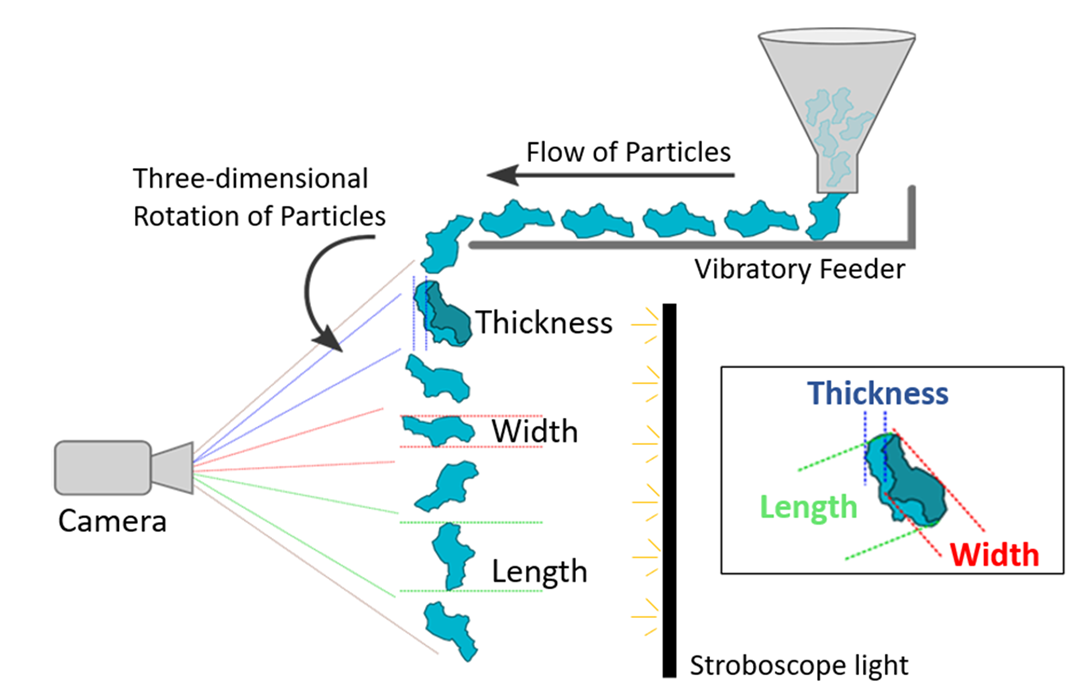
The online particle analyzer is placed within the particle flow, where it analyses the shape and size of the sample particles that are let through it.
The particles will have a natural rotation when they drop from the vibrating feeder into the measurement zone where a stroboscopic light source and a high speed and high-resolution camera analyzes the size and shape of every single particle in the flow.

Particles flow through analyzer for size and shape analysis
In the particle track, the software determines the width and the length of each particle projection:
- the largest value of all length measurements within a particle track is the “3D length” of the particle
- the largest value of all width measurements within a particle track is the “3D width” of the particle
- the smallest value of all width measurements within a particle track is the “3D thickness” of the particle
Thus, for particles with three different dimensions (e. g. almonds), the size distributions of all three dimensions can be output separately.
3D Analysis is particularly advantageous for particles that are supposed to have a specific shape like spheres, rods (extrudates), lenses or ellipsoids (“rugby-ball”-shape).
Particle size distributions utilizing one or multiple size parameters can be reported, and powerful filter functionality can enable the user to isolate groups of particles of particular interest to them and perform more targeted analysis
All measurements and results are recorded online in real-time including particle shape and size distribution. Further analysis of the stored data can be done in the “offline” mode where samples can be measured with greater accuracy and much less effort than with conventional techniques.
Digital particle analysis vs. sieving methods
Compared to traditional sieving methods, online particle size analysis offers superior robustness and accuracy.
Sieving processes are prone to particle stacking and sieve breakage, leading to inconsistent operation and prolonged cycle times due to manual sieving, weighing, documentation, and reporting. Moreover, manual procedures introduce a higher risk of human error in the analysis process.
Digital Image Analysis offers several advantages over sieve analysis:
Speed and Accuracy: Digital particle analysis allows for rapid and accurate measurements compared to the time-consuming and less precise process of sieve analysis. By taking an image of the material sample and using software for analysis, results can be obtained quickly and with very high accuracy.
Non-contact Analysis: With digital particle analysis, materials can be analyzed without the need for physical handling. This is particularly advantageous in industries like agriculture, where handling food products can risk contamination.
Versatility: Photo analysis equipment and software are adaptable across various industries including mining, fertilizer, chemicals, and recycling. This versatility allows for widespread application and efficiency in different contexts.
The software can be configured to look for particular particle shapes that can indicate a runaway process. It can also be used for online process optimization by feeding a signal back into the process control system.
In contrast, sieve analysis, while simple, has its limitations:
Particle Size Range: Sieve analysis is limited in its ability to separate particles that are too small for practical separation by sieving. This can lead to incomplete or inaccurate results, especially when dealing with fine particles.
Elongated particles: Sieve analysis has a built-in error/bias as elongated particles can pass through the sieve and thereby end up in the wrong sieve fraction. This can lead to incomplete or inaccurate results.
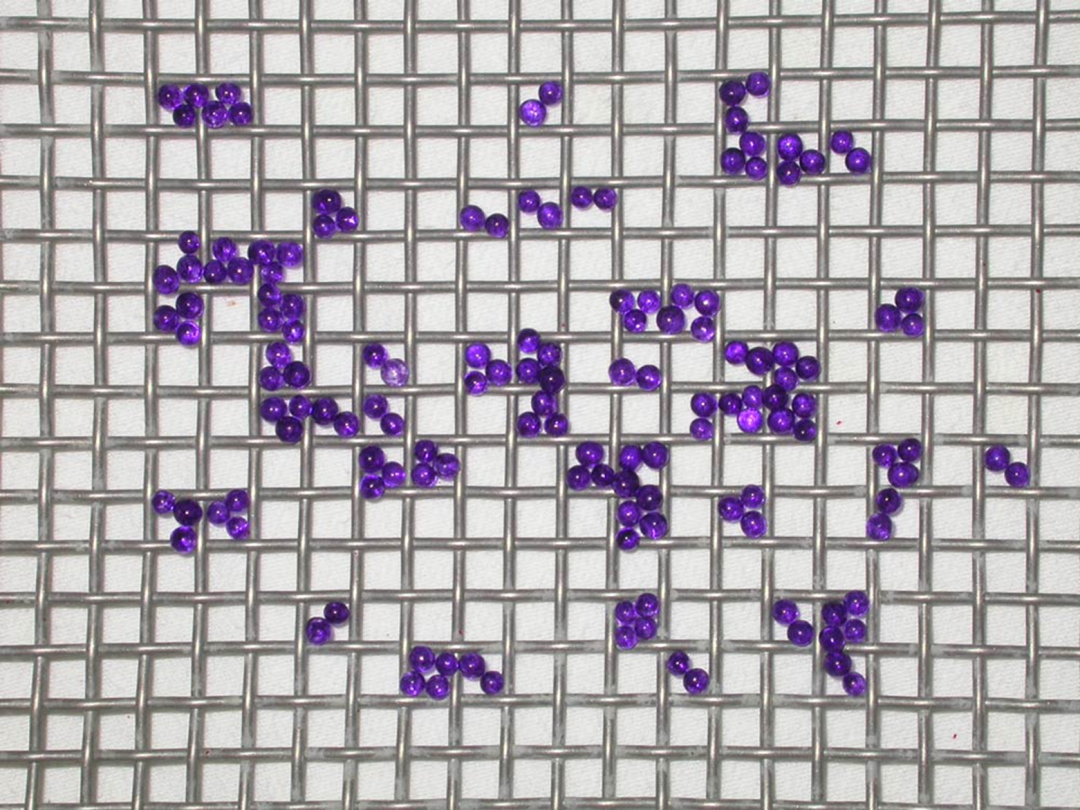
Blocked particles: Sieve analysis has the potential of building up materials if and when particles are blocking oneanother in the mesh. Again, this will lead to incomplete or inaccurate results and will eventually require a clearing/clearing of the sieve.

Particles may fail going through a sieve and end up blocking passage through the sieve
Fragility of Sieves: Fine sieves, necessary for analyzing smaller particles, are fragile and difficult to work with. A 37 μm sieve, for example, is very delicate and challenging to handle without damage.
Energy Dependency: The amount of energy used during sieving is arbitrarily determined, which can impact the results. Over-energetic sieving can cause attrition of particles, altering the particle size distribution (PSD), while insufficient energy may fail to break down loose agglomerates.
Manual Inefficiency: Manual sieving procedures are often inefficient and may not yield consistent results. While automated sieving technologies do exist, they still rely on physical sieving and will never be as versatile or efficient as photo analysis methods.
In summary, digital particle analysis offers advantages in terms of speed, accuracy, non-contact analysis, and versatility, making it a preferred choice for many industries over traditional sieve analysis methods.
Particle size distribution with a Camsizer Online
Particle Size Distribution (PSD) – or granulometry – refers to the arrangement of particles within a sample based on their sizes. Imagine how many different sizes and shapes crushed iron ore can contain. The size distribution helps us understand how many particles fall into specific size categories. These categories can be user defined and not limited to the otherwise “chosen” number of sieves.
A range analysis of the distribution of particle sizes lists the number of particles within each size range separately, which is useful when understanding the material. Cumulative analysis, on the other hand, adds up the amount of material that passes through, providing a broader perspective on the distribution across different size ranges.
It’s important to note that defining “size” isn’t always straightforward, but the digital 3D shape analysis is significantly better than sieves.
Improved measurement accuracy
While sieves typically have a tolerance of +/- 5% in size, the particle analyzer achieves a tolerance of +/- 2%. This means that a particle registered as 5 mm in a sieve may range from 4.75mm to 5.25mm, whereas the Camsizer’s measurement falls within a tighter range of 4.9mm to 5.1mm. As the sieves wear out the tolerance will become larger whereas with the Camsizer it will stay constant.
Roundness vs. Non roundness
Another advantage of digital particle analysis is the ability to program the software to identify particle shapes and quantify characteristics such as roundness.

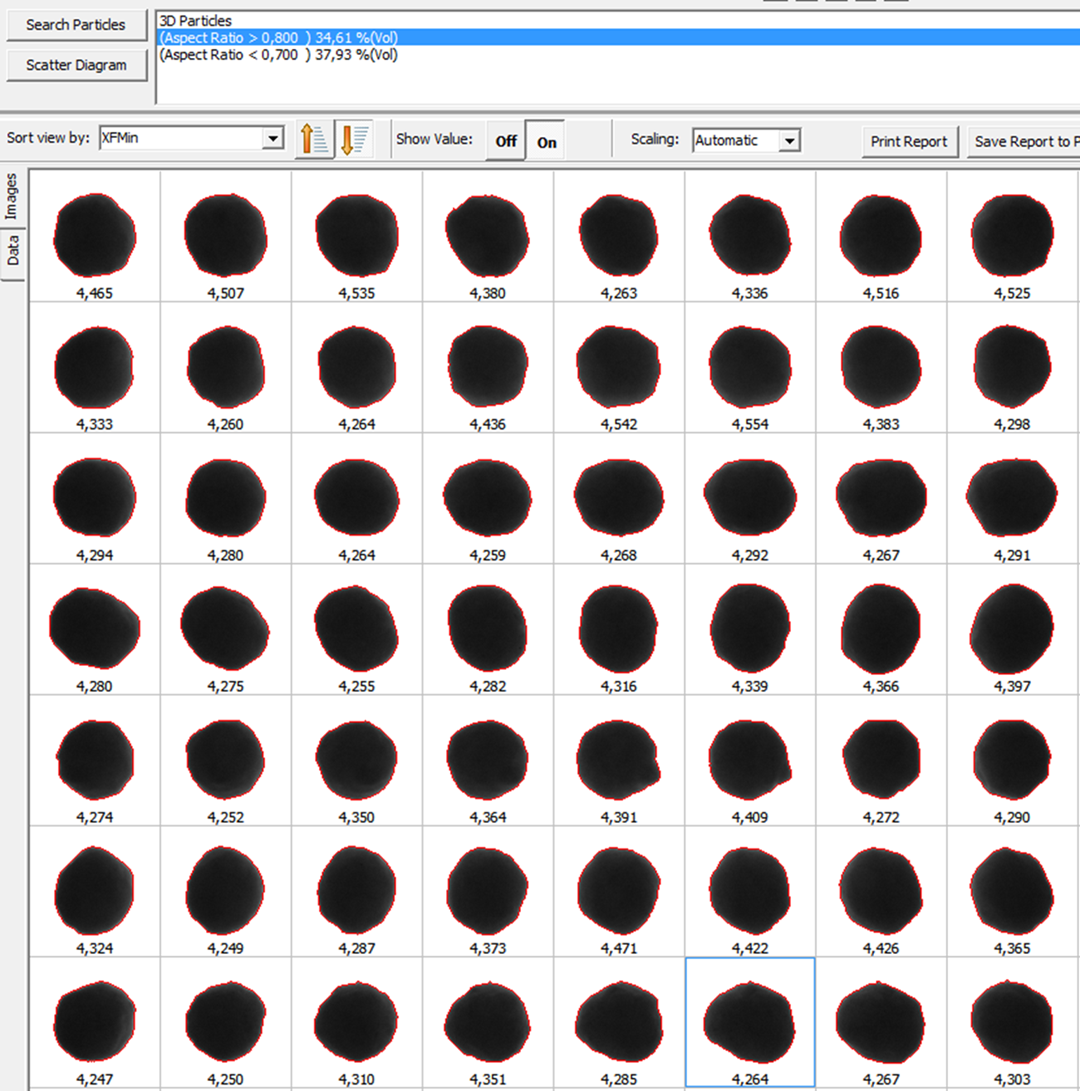
Round particles should be round from all angles

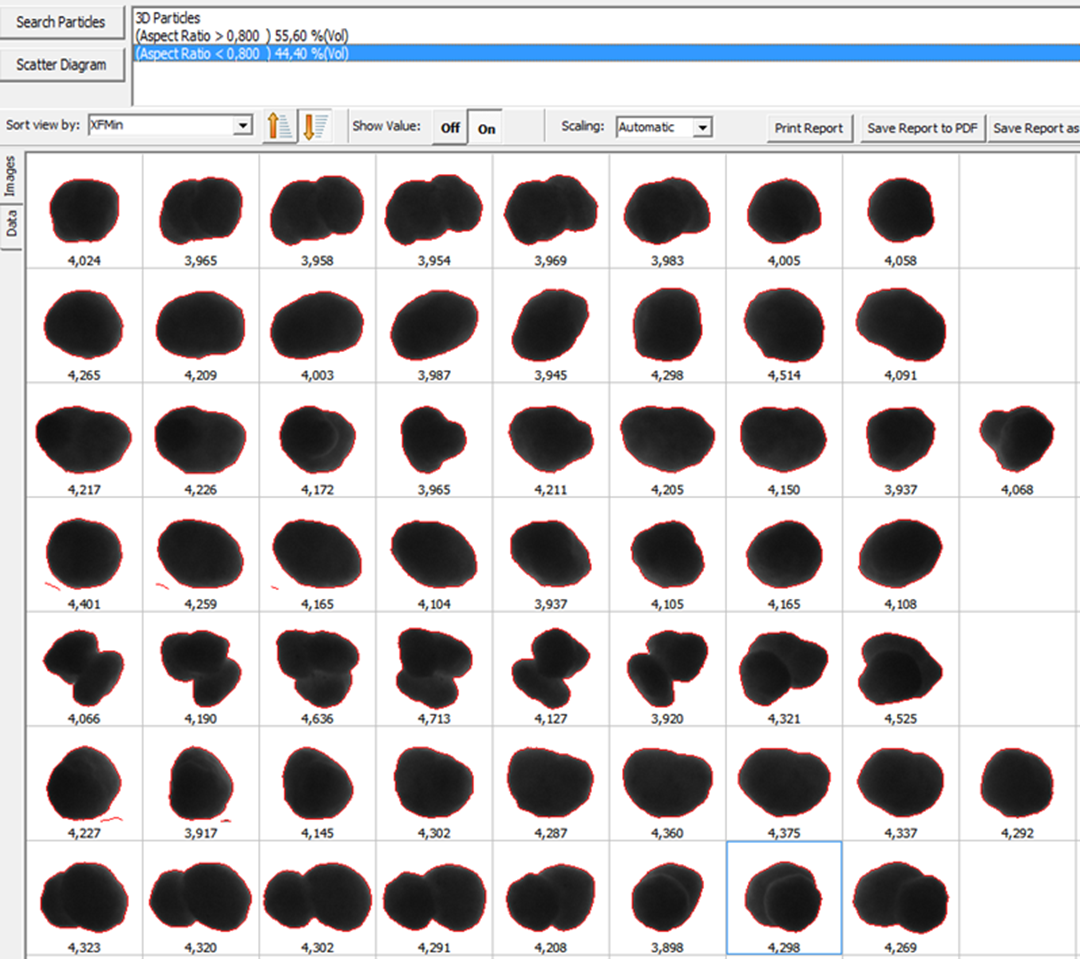
Non-round particles could be round from one angle, but not all
How the particle size is measured
The software analyzes particle size by pixel and measures key parameters such as area, perimeter, and diameter for each particle.
Where can particle analysis be used?
The Camsizer Online particle size analyzer finds application across various industries, including:
- Fertilizer (eg. potassium salts and phosphates)
- Chemicals (eg. polyurethanes, plastics/polmers)
- Mining and Minerals/Metals Processing (eg. iron ore and other ores)
- Building and Construction Materials (eg. industrial sands)
- Recycling Operations (eg. batteries, plastics)
- Biomass (eg. wood pellets, chips)
- Food and Feed Processing (eg. foods, cat litter)
The Camsizer Online particle size and shape analyzer integrates seamlessly with JAWO Sampling Solutions, catering to a diverse range of industries and mined materials.
Camsizer Online 30 or Camsizer Online 135
Mark & Wedell offer two variants of the Camsizer Online particle size analyzer: one for smaller particles (30µm to 30mm) and another for larger particles (160µm to 135mm).
The analyzer can be configured to operate at intervals ranging from every 3 to 20 minutes, allowing for 20 to 3 cycles per hour. During operation, the particle analyzer tracks each particle in the flow, capturing images of all falling particles.
When paired with JAWO Sampling solutions, such as a Vezin Sampler, Bucket Sampler, or a Cross belt sampler, the combined system significantly enhances throughput, sampling accuracy, and operational consistency.